State quarters · 1999–2008 · checklist
50 State Quarters: The Full Checklist and Which Are Worth More
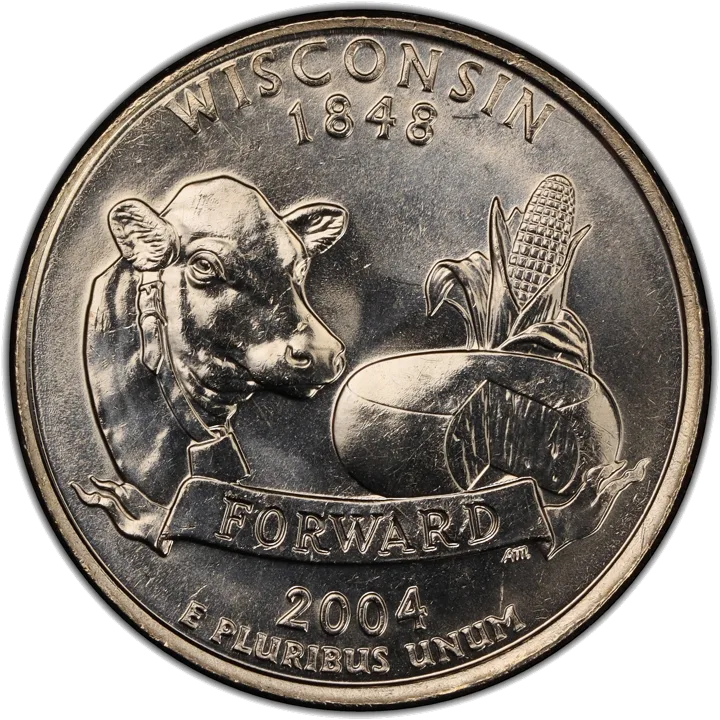
The US Mint made 34,797,600,000 state quarters for circulation from 1999 to 2008, five states a year. Oklahoma has the lowest mintage (416,600,000) and Virginia the highest (1,594,616,000), so no state quarter is rare just by its state: a worn one is worth 25 cents. The ones worth more are errors, varieties and silver proofs, like the 2004-D Wisconsin extra leaf.
- Years
- 1999–2008, five states a year
- Order
- The order states ratified the Constitution or joined the Union
- Made
- 34,797,600,000 for circulation (P and D)
- Lowest mintage
- Oklahoma (2008): 416,600,000
- Highest mintage
- Virginia (2000): 1,594,616,000
- Proofs
- San Francisco (S), in clad and 90% silver
How to tell if you have one
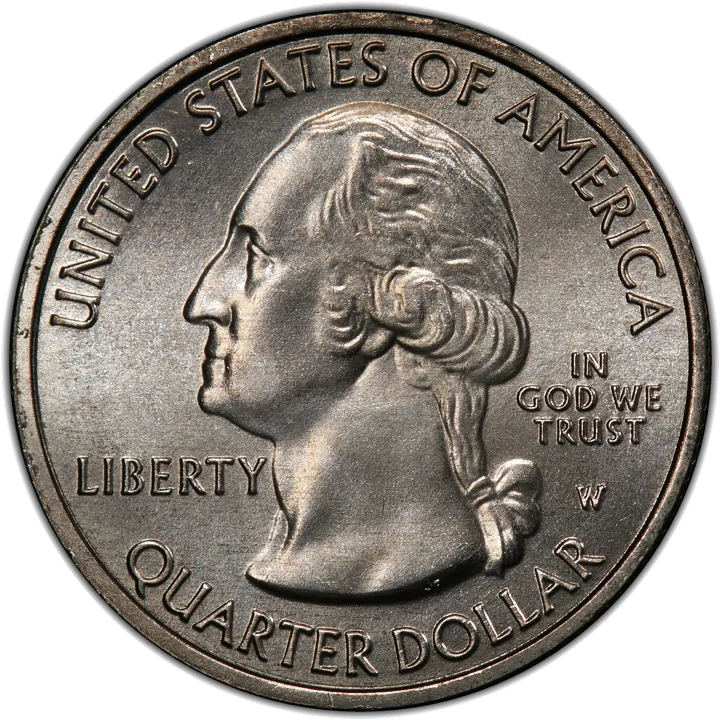
- Find the state and year on the back, then the mint mark (P or D, or S on proofs) on the front, right of Washington’s hair ribbon.
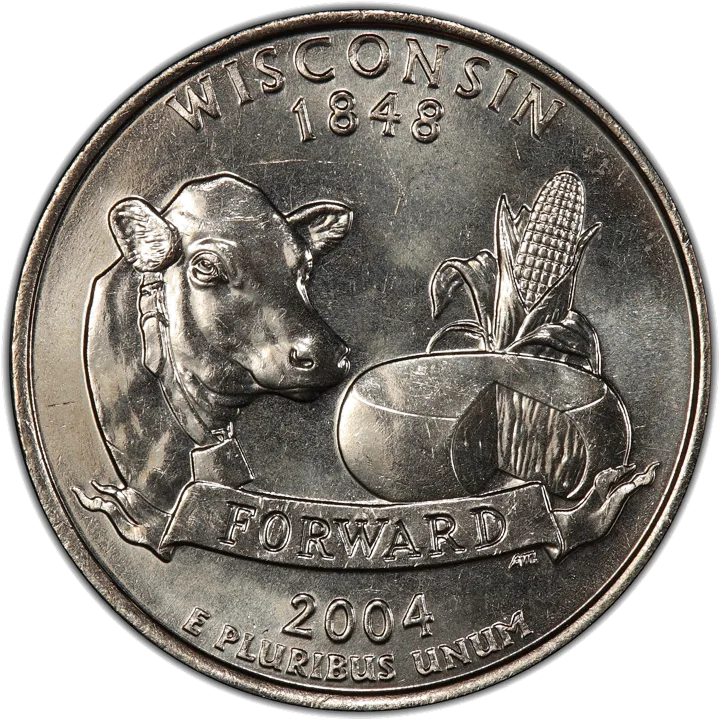
- 2004-D Wisconsin: look at the lower left of the ear of corn for an extra leaf pointing up (High) or across (Low).
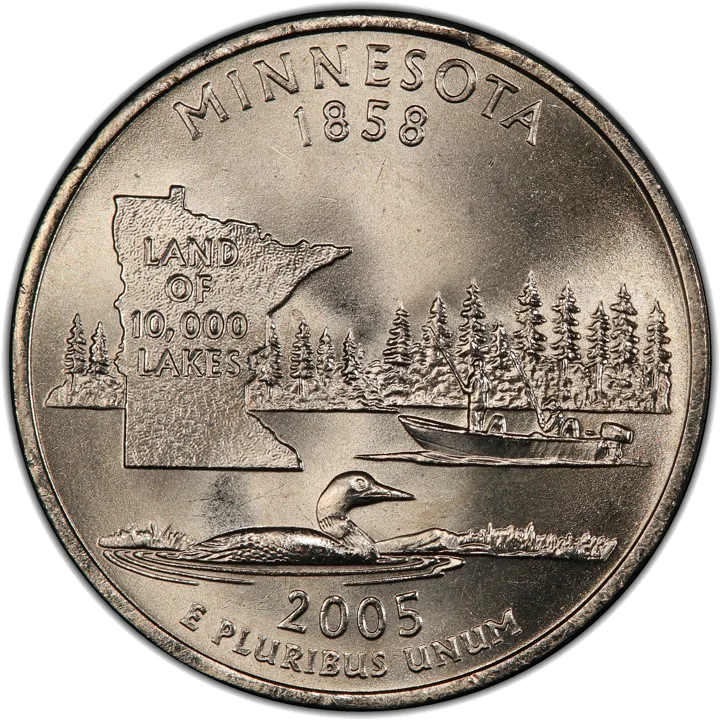
- 2005-P Minnesota: look at the pine trees on the right; a doubled tree is an extra tree variety.
- 2005-P Kansas: read the motto on the front; a missing T in TRUST is a grease-filled die.
- A golden 1999 quarter: weigh it. The real experimental pieces weigh about 5.9 to 6.3 g, against 5.67 g for a normal quarter. Plated novelty quarters are far more common.
Which state quarters are worth more than 25 cents
- 2004-D Wisconsin extra leaf: an extra leaf on the ear of corn, High or Low. Lightly worn ones sell for about $80 to $110, and the reported record is $6,000.
- 1999 quarters on experimental golden blanks: in 1999 the Mint tested the metal for the new Sacagawea golden dollar by striking it with state quarter dies. They’re golden all the way through and overweight (about 5.9 to 6.3 g against 5.67 g). A 1999-P Connecticut in MS62 sold for $7,015 at Heritage in June 2026 (reported by Mint Error News).
- Silver proofs: the S-mint silver proofs, sold only in silver proof sets, contain about 0.18 oz of silver each, so they’re worth at least their silver.
- 2005-P Minnesota “extra tree”: a family of doubled die varieties where a pine tree on the back is doubled. The main one (DDR-001) had a PCGS-listed record of $150 in MS66 in 2015.
- 2005-P Kansas “In God We Rust”: grease filled the T of TRUST on the die. We found no reliable auction record; most sell for a few dollars at most.
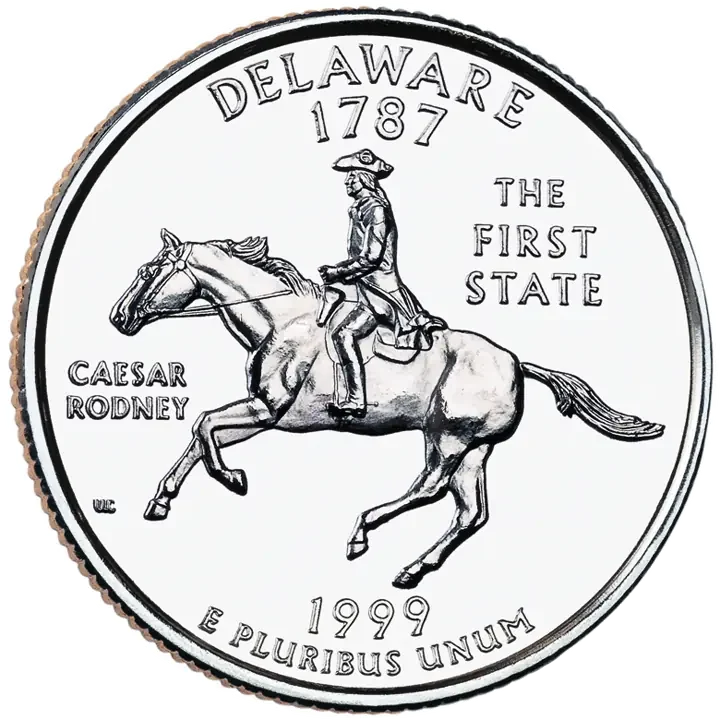
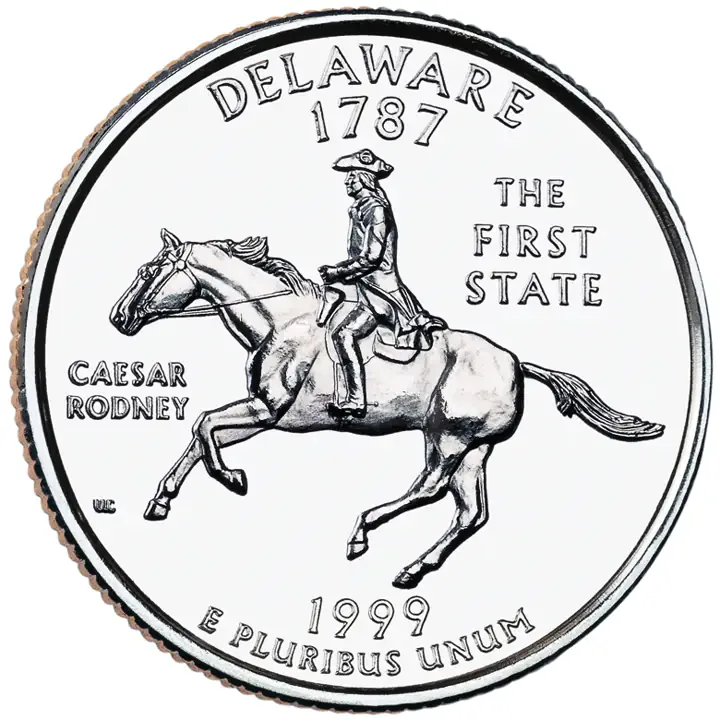
- 1999-P Delaware “spitting horse”: a die crack from the horse’s mouth. Real, but common: recent sales run $2 to $6.
- Top-grade regular coins: a perfect-looking ordinary state quarter in MS68 or MS69 can sell for real money, but anything from circulation is worth face value.
How the program worked
Congress created the program in 1997 (Public Law 105-124). Each year the Mint released five new designs, in the order the states ratified the Constitution or were admitted to the Union, starting with Delaware on January 4, 1999 and ending with Hawaii on November 3, 2008. Each design was minted for about ten weeks and never again.
Mintages had little to do with a state’s size. Production was highest in 1999 to 2001, when the coins were new and everyone was saving them, and lowest in 2003 and 2004. That’s why small Virginia (2000) tops the list and big states like California and Texas (2004–2005) are well below average.
Every state quarter, in release order
Mintages for circulation from the US Mint. The lowest (Oklahoma) and highest (Virginia) are in bold. Scroll the table sideways on a phone.
| # | State | Released | Philadelphia (P) | Denver (D) | Total |
|---|---|---|---|---|---|
| 1 | Delaware | January 4, 1999 | 373,400,000 | 401,424,000 | 774,824,000 |
| 2 | Pennsylvania | March 8, 1999 | 349,000,000 | 358,332,000 | 707,332,000 |
| 3 | New Jersey | May 17, 1999 | 363,200,000 | 299,028,000 | 662,228,000 |
| 4 | Georgia | July 19, 1999 | 451,188,000 | 488,744,000 | 939,932,000 |
| 5 | Connecticut | October 12, 1999 | 688,744,000 | 657,880,000 | 1,346,624,000 |
| 6 | Massachusetts | January 3, 2000 | 628,600,000 | 535,184,000 | 1,163,784,000 |
| 7 | Maryland | March 13, 2000 | 678,200,000 | 556,532,000 | 1,234,732,000 |
| 8 | South Carolina | May 22, 2000 | 742,576,000 | 566,208,000 | 1,308,784,000 |
| 9 | New Hampshire | August 7, 2000 | 673,040,000 | 495,976,000 | 1,169,016,000 |
| 10 | Virginia | October 16, 2000 | 943,000,000 | 651,616,000 | 1,594,616,000 |
| 11 | New York | January 2, 2001 | 655,400,000 | 619,640,000 | 1,275,040,000 |
| 12 | North Carolina | March 12, 2001 | 627,600,000 | 427,876,000 | 1,055,476,000 |
| 13 | Rhode Island | May 21, 2001 | 423,000,000 | 447,100,000 | 870,100,000 |
| 14 | Vermont | August 6, 2001 | 423,400,000 | 459,404,000 | 882,804,000 |
| 15 | Kentucky | October 15, 2001 | 353,000,000 | 370,564,000 | 723,564,000 |
| 16 | Tennessee | January 2, 2002 | 361,600,000 | 286,468,000 | 648,068,000 |
| 17 | Ohio | March 11, 2002 | 217,200,000 | 414,832,000 | 632,032,000 |
| 18 | Louisiana | May 20, 2002 | 362,000,000 | 402,204,000 | 764,204,000 |
| 19 | Indiana | August 2, 2002 | 362,600,000 | 327,200,000 | 689,800,000 |
| 20 | Mississippi | October 15, 2002 | 290,000,000 | 289,600,000 | 579,600,000 |
| 21 | Illinois | January 2, 2003 | 225,800,000 | 237,400,000 | 463,200,000 |
| 22 | Alabama | March 17, 2003 | 225,000,000 | 232,400,000 | 457,400,000 |
| 23 | Maine | June 2, 2003 | 217,400,000 | 231,400,000 | 448,800,000 |
| 24 | Missouri | August 4, 2003 | 225,000,000 | 228,200,000 | 453,200,000 |
| 25 | Arkansas | October 20, 2003 | 228,000,000 | 229,800,000 | 457,800,000 |
| 26 | Michigan | January 26, 2004 | 233,800,000 | 225,800,000 | 459,600,000 |
| 27 | Florida | March 29, 2004 | 240,200,000 | 241,600,000 | 481,800,000 |
| 28 | Texas | June 1, 2004 | 278,800,000 | 263,000,000 | 541,800,000 |
| 29 | Iowa | August 30, 2004 | 213,800,000 | 251,400,000 | 465,200,000 |
| 30 | Wisconsin | October 25, 2004 | 226,400,000 | 226,800,000 | 453,200,000 |
| 31 | California | January 31, 2005 | 257,200,000 | 263,200,000 | 520,400,000 |
| 32 | Minnesota | April 4, 2005 | 239,600,000 | 248,400,000 | 488,000,000 |
| 33 | Oregon | June 6, 2005 | 316,200,000 | 404,000,000 | 720,200,000 |
| 34 | Kansas | August 29, 2005 | 263,400,000 | 300,000,000 | 563,400,000 |
| 35 | West Virginia | October 14, 2005 | 365,400,000 | 356,200,000 | 721,600,000 |
| 36 | Nevada | January 31, 2006 | 277,000,000 | 312,800,000 | 589,800,000 |
| 37 | Nebraska | April 3, 2006 | 318,000,000 | 276,400,000 | 594,400,000 |
| 38 | Colorado | June 14, 2006 | 274,800,000 | 294,200,000 | 569,000,000 |
| 39 | North Dakota | August 28, 2006 | 305,800,000 | 359,000,000 | 664,800,000 |
| 40 | South Dakota | November 6, 2006 | 245,000,000 | 265,800,000 | 510,800,000 |
| 41 | Montana | January 29, 2007 | 257,000,000 | 256,240,000 | 513,240,000 |
| 42 | Washington | April 2, 2007 | 265,200,000 | 280,000,000 | 545,200,000 |
| 43 | Idaho | June 4, 2007 | 294,600,000 | 286,800,000 | 581,400,000 |
| 44 | Wyoming | September 4, 2007 | 243,600,000 | 320,800,000 | 564,400,000 |
| 45 | Utah | November 5, 2007 | 255,000,000 | 253,200,000 | 508,200,000 |
| 46 | Oklahoma | January 28, 2008 | 222,000,000 | 194,600,000 | 416,600,000 |
| 47 | New Mexico | April 7, 2008 | 244,200,000 | 244,400,000 | 488,600,000 |
| 48 | Arizona | June 2, 2008 | 244,600,000 | 265,000,000 | 509,600,000 |
| 49 | Alaska | August 25, 2008 | 251,800,000 | 254,000,000 | 505,800,000 |
| 50 | Hawaii | November 3, 2008 | 254,000,000 | 263,600,000 | 517,600,000 |
Totals are from the US Mint’s 50 State Quarters Report; the P and D split is from CoinNews’s tables of Mint production, and every row adds up to the Mint’s total. Wikipedia’s table has errors for South Carolina, Montana and New York, so don’t copy it.
Coins that fool people
Gold-plated quarters
Plated novelties are everywhere. A real experimental-blank 1999 quarter is overweight, slightly thick and golden through the edge.
Machine doubling on the Minnesota trees
Flat, shelf-like doubling is machine doubling and worthless. A real extra tree has a raised, rounded second tree.
A scratched “extra leaf”
A scratch is cut into the coin. The real Wisconsin extra leaf is raised, because the damage was on the die.
Fill the album and catch the errors
AnyCoins knows every coin in the 50 State Quarters set. Scan your quarters and it puts each one in the right slot, and tells you if one of them is a variety worth more than 25 cents.
- Photograph each quarter, heads side then tails side.
- AnyCoins identifies the state, year and mint and checks it for known errors.
- It goes into your 50 State Quarters album, with a value if it’s worth more than face.

Why collectors use AnyCoins
- Photograph both sides and it names the coin: country, year, mint and denomination.
- Values from real sales: a price range by condition and recent sales of the same coin, not a guess.
- A condition estimate from your photos, so you know which row of the price table you’re in.
- Checks the coin for known errors and varieties, the kind that turn a cent into thousands.
- Melt value for silver and gold, and the mint that struck it on the Mint Map.
Questions people ask
Which state quarter is the rarest?
By mintage, Oklahoma (2008): 416,600,000 made for circulation, the lowest of the 50. Virginia (2000) is the highest at 1,594,616,000. Even Oklahoma is common in circulation.
Are any state quarters worth a lot of money?
Only errors, varieties and top grades: the 2004-D Wisconsin extra leaf’s reported record is $6,000, and 1999 quarters on experimental golden blanks sell for thousands.
How many state quarters were made?
34,797,600,000 for circulation from 1999 to 2008, roughly half at Philadelphia and half at Denver.
In what order were state quarters released?
In the order the states ratified the Constitution or joined the Union, five a year, starting with Delaware on January 4, 1999 and ending with Hawaii on November 3, 2008.
Are silver state quarters worth more?
Yes. The S-mint silver proofs contain about 0.18 oz of silver each, so they’re worth at least their silver. They came only in silver proof sets.
Sources
- US Mint: 50 State Quarters Report (2009, archived PDF)
- US Mint: 50 State Quarters program
- CoinNews: State Quarter Coin Production Figures by US Mint, Year and State
- PCGS: PCGS Grades Wisconsin State Quarter Major Varieties (2005)
- Fox Business: 2004 Wisconsin state quarters could be worth up to $6K
- Mint Error News: Prices realized, Heritage June 2026 Error Coinage auction
- Numismatic News: Experimental planchets used for state quarters
- PCGS CoinFacts: 2005-P Minnesota Extra Tree DDR-001 (#144227)
- APMEX: Kansas State Quarter Errors
Prices are public auction results including the buyer’s premium unless marked as a price guide. A coin’s value depends on its exact condition and on having it certified by a grading service such as PCGS or NGC.